
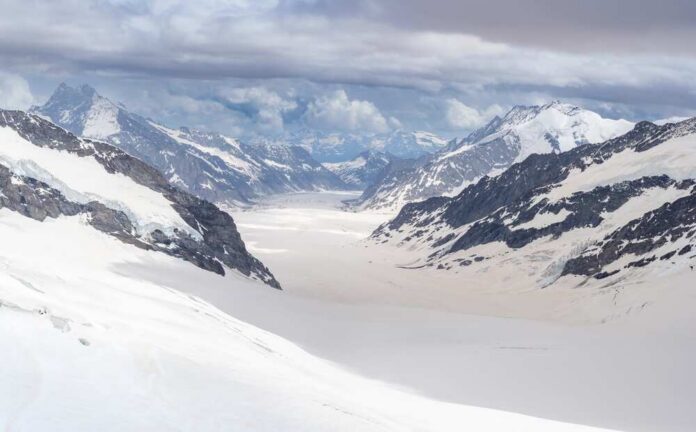
Switzerland lost about a tenth of its glacier ice in just two years, a shift so fast it rewrote a century of records and expectations.
Story Snapshot
- Scientists measured a 10% drop in Swiss glacier volume from 2022 to 2023.
- Official programs tracked mass balance on about 20 glaciers and terminus change on 95.
- Heat waves and low winter snow drove the back-to-back losses.
- This is part of a 140-year monitoring record, not a one-off.
What Exactly Happened To Swiss Glaciers
Glacier Monitoring Switzerland reported two severe melt seasons in a row. The 2022 summer stripped roughly six percent of ice volume. The 2023 summer erased about four percent more. Together, that equals a 10% loss in only two years, the steepest two-year decline on record for the country. The monitoring body tied this to extreme summer heat and a thin winter snowpack that failed to protect the ice at the start of melt season. These losses were measured, not modeled guesses.
Field teams measured annual mass balances on about 20 benchmark glaciers across the Alps. These sites anchor a national index that rolls up to a Swisswide total each year. Surveyors also tracked how far glacier snouts pulled back. In 2023 they documented terminus change on 95 glaciers, offering a wide-angle view of retreat beyond the mass-balance network. This dual approach—depth of detail at key sites and broad coverage of fronts—lets scientists check the big picture against ground truth.
Why This Year Stood Out In A Long Record
Switzerland has monitored glacier changes since 1880, building one of the longest such records on Earth. The country’s system captures many ordinary years and the rare ones that aren’t. The 2022 and 2023 pair land in the latter group. Both summers brought intense heat that increased melt at all elevations. Low winter snow left the spring surface dark and exposed, which absorbed more sun and sped up thaw once melting began. The result was rapid ice loss across regions that often behave differently.
Officials emphasized that these years did not come out of nowhere. The national program frames each season within a long trend of shrinking ice and rising melt-season extremes. The two-year drop is also visible in updated national summaries that benchmark volume change across decades. The reporting from the Swiss Academy system presents these findings as part of a continuous series rather than an isolated shock. That is why the numbers carry weight far beyond one summer.
What The Numbers Mean For Water, Power, And Risk
Less ice means less long-term storage. Glaciers act like savings accounts for mountain water. In hot months, that melt smooths out river flow for farms, towns, and power stations. When the account shrinks, the buffer weakens. Swiss experts and outlets have warned that rapid losses can stress hydropower planning, which depends on predictable flow timing and volume during peak demand. Alpine communities also face shifting rockfall and flood risks as ice that once pinned slopes in place pulls back.
Swiss glaciers lost 5.5% of their ice volume in 2026, bringing the total loss to nearly 20% since 2021. Scientists attribute the rapid melting to record summer heatwaves and unusually low winter snowfall pic.twitter.com/6FkZx40BQG
— TSN NEWS (@TSNGlobalNews1) October 2, 2026
The water story is not simple. Extra melt can boost summer flow for a few years even as total ice stores drop. But once the ice volume falls below key thresholds, the boost flips to a drag. Managers then see more erratic rivers, sharper lows, and harder trade-offs in dry spells. That is why scientists focus on trends over time, not only a single hot season. The two-year, 10% hit moved the baseline in a way planners must price in now.
How Scientists Know And Why It Matters
Switzerland’s glacier teams mix classic fieldwork with modern mapping. Crews drill stakes into ice to log how much surface height changes through a year. They dig snow pits to measure how much winter snow fell and how dense it is. They map glacier fronts each year to track how far the ice has pulled back. They combine these results with national aerial images and inventories to scale up from single glaciers to the whole network. The process is open, repeatable, and documented.
That rigor makes the message hard to shrug off. A two-year, 10% cut is not a headline built on a model run or a dramatic photo alone. It rests on decades of the same measurements taken in the same places by trained teams. It sits inside a 140-year line of observation that shows where this is going if hot summers and low snow keep pairing up. Common sense says you do not run your accounts down and expect steady payouts. The Alps are now living that math.
Sources:
bbc.com, cryosphere.scnat.ch, doi.glamos.ch, geo.uzh.ch, telegraphherald.com